Using the Roslyn Syntax Visualizer
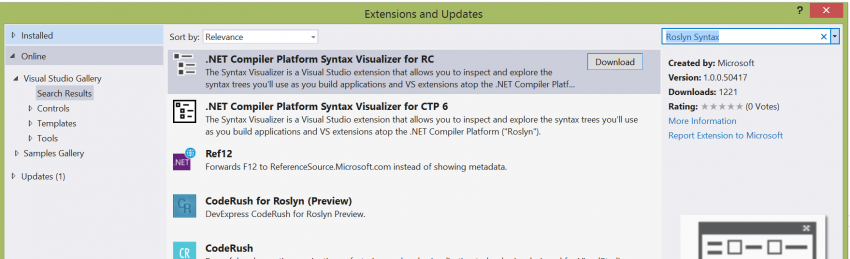
If you plan on creating an analyzer that analyzes more than just simple types, you are going to have to get familiar with the syntax graph. Luckily the Roslyn team has created a syntax visualizer that lets you see the syntax graph of the code that is currently selected in the IDE. First steps first, you need to download the syntax visualizer from the Extensions and Updates section in Visual Studio. Do a search for "Roslyn Syntax" and it should be one of the first items in the list.
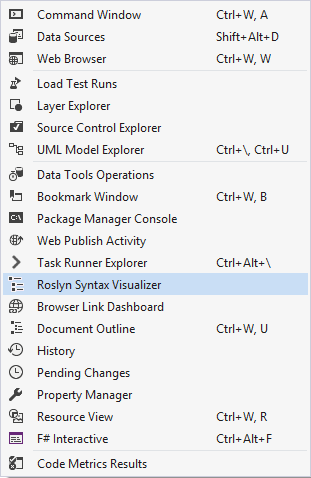
Make sure you get the visualizer that matches version of Visual Studio that you have installed. You will need to restart Visual Studio after installing the visualizer. You can now navigate to the View->Other Windows menu and the Roslyn Syntax Visualizer is available from there.
Now, as you navigate through your code, you can see the syntax graph that represents the code at the location of your cursor. For example, I have the following code:
namespace WindowsFormsApplication1
{
    public class Class1
    {
        public Class1()
        {
            var x = 1;
            System.Console.WriteLine(x);
        }
    }
}
The syntax visualizer will show the following:
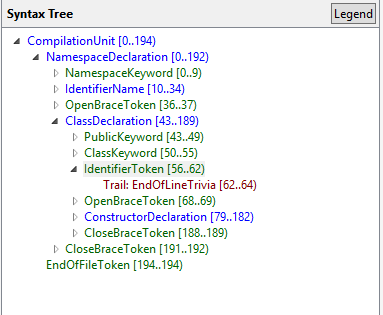
Using this view allows you to understand all of the types of tokens that are in use and how to traverse the nodes in a code analysis document. The visualizer also provides a graph view of the syntax graph. Simply select any node and click the View Directed Syntax Graph menu item.
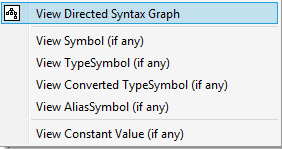
Selecting this option will open a graphical view of the syntax graph. I recommend focusing on a method or block of code when opening this view, as even small chunks of code have a decent sized graph. For example, the two line constructor above is represented by the following graph:
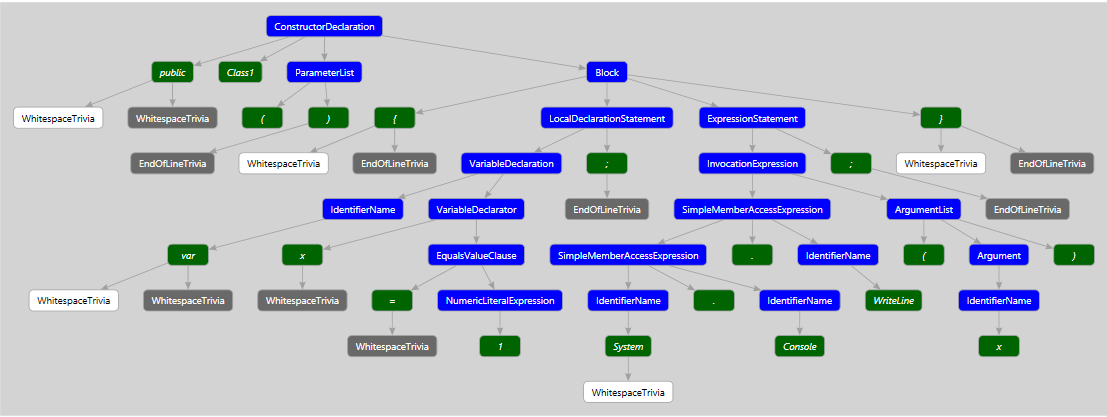
As you can see the visualization tools provided by the Roslyn team give you great insights into the structure of your code and when you go to build analyzers that need to manipulate blocks of code, these tools will be invaluable. Also, don't forget to install the visualizer into all of your experimental instances or you might get caught scratching your head as to why you can't find the menu item. In a future post, we will discuss how we can use the visualizer when building a real world analyzer.