CPU Profiling in Visual Studio 2015 Update 1
In the past, I have covered the Diagnostics Tools and all of the new features that are available in VS 2015. With the upcoming release of update 1, some new features are being added to the diagnostics tools.
When you open the diagnostics tools, you'll notice the CPU Usage tab now shows you information like the Total CPU % and Self CPU %.
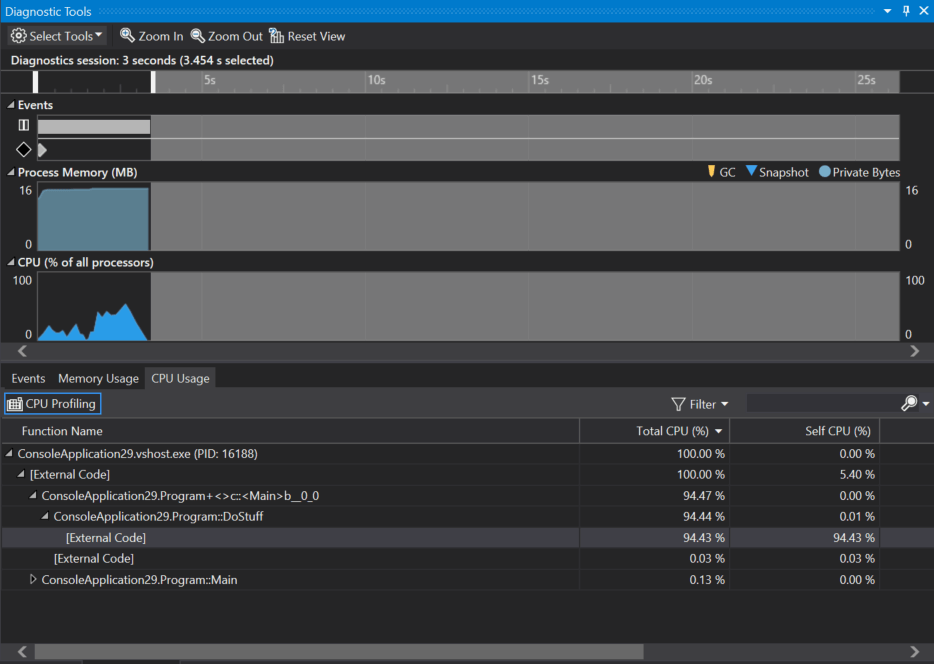
The total CPU % covers the method and all child methods that it calls, while the self CPU is limited to only the code within the method, excluding all child calls. Using these values you can quickly determine what are your most costly functions in terms of CPU %.
The CPU percentage also works with the range selection in diagnostics tools window. So, if you want to just hone in on one section of your app where the CPU is spiking, this tool allows you to do this.
[video width="1028" height="580" mp4="/content/DiagnosticToolsWithCPU.mp4"][/video]
Overall, I think this is a great addition to Visual Studio and I can't wait to see how people use it. If you want more in depth information on the new CPU features in the diagnostics tools, Nikhil Joglekar has a blog post that covers it in quite a bit of detail.