Analyzing Memory Usage in Visual Studio 2015
The new diagnostic tools in Visual Studio 2015, provide a great deal of troubleshooting tools to help debug various problems in your application. One piece that I think is really nice is the memory usage information and the ability to snapshot memory and compare differences. If you are trying to location a memory leak in a certain area of code, you can take a snapshot before and after running the code and see the delta of objects and their sizes.
Let's create a simple example that never frees up memory to show how we can use these tools. We'll continually create strings in a loop and add them to a hashset, never freeing them. Our string in y is going to continue to grow the more times the loop is executed.
static void Main(string[] args)
{
    var strings = new HashSet<string>();
    string y = "";
    for (int i=0; i<50000; i++)
    {
        y = y + i.ToString();
        strings.Add(y);

        Console.WriteLine(i);
        System.Threading.Thread.Sleep(1);
    }
}
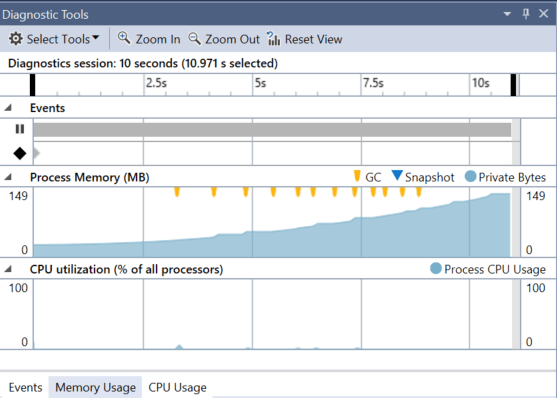
Now, if I start the application, the Diagnostics Tools window appears and within 10 seconds, my application is already consuming 150MB of RAM and growing quickly.
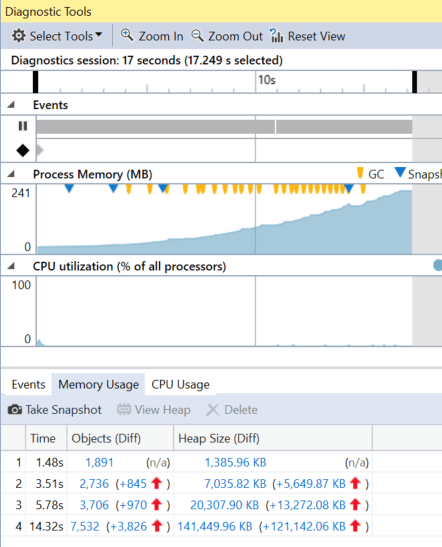
If you open the Memory Usage tab, you'll see a button that allows you to take snapshots. If you click this a few times, you'll get a few memory snapshots. These are indicated by blue triangles in the memory graph. You'll also see them listed in below the Take Snapshot button.
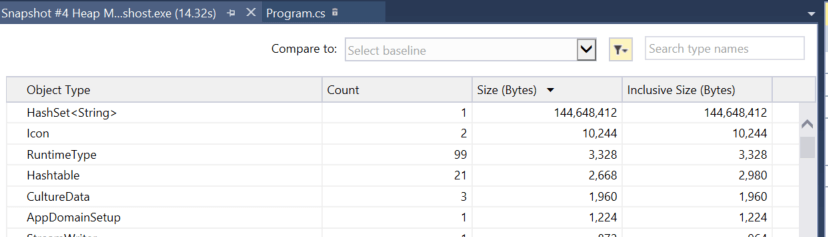
Inisde the list of memory snapshots, you'll notice that Objects and Heapsize columns have blue text, which is clickable. This will take you into a detail view for the snapshot. For the Objects view, you will see all of the object types that are in memory and metrics around the number and size of objects. You can sort by the column headers to find if you have a lot of small objects that add up to a lot of memory or one large object eating it all up. In our example, if I sort by size, it's very obvious what the culprit is.
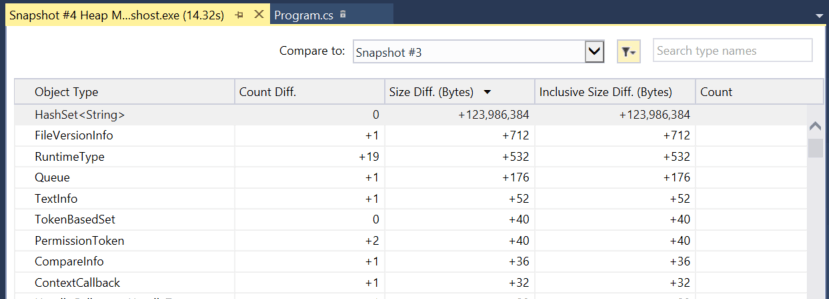
Inside this view, there is also the Compare To drop down, which allows you to compare the current snapshot to another snapshot to see the deltas between the two snapshots. So, if I select a previous snapshot, I get some additional columns that provide the differences from the baseline snapshot to the currently selected snapshot. Again, in my example it is very obvious which object is growing, but these deltas may be very useful when the leak is not so obvious.
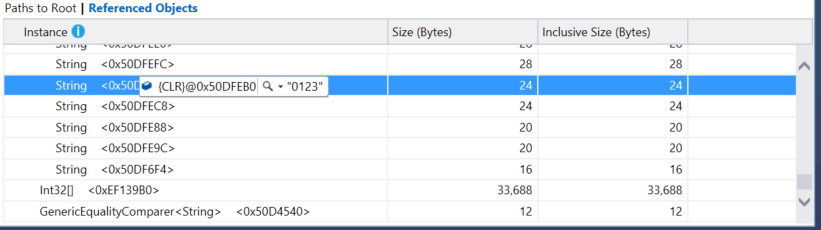
You can double click on any object in the snapshot and drill into it further. You'll see that there are Paths to Root and Referenced Types views available. The Paths To Root view gives you the ability to figure out what is holding on to your object and the reference counts. This view lets you walk up the entire parent tree of objects that have references. This may help you figure out the root cause of what object isn't being released that needs to be.
The Referenced Types view is a downward view of all of the objects that this object is holding on to. Since our example involves a HashSet, we can see all of the instances of the strings that it is holding on to. If you pause the program and use a snapshot of the current state of the program, you can even see the values inside the objects inside the HashSet.
As you can see, inside that little diagnostic tools dialog, there are a lot of really nice features that can make tracking down memory problems just a little bit easier. Do you have a tip on using the diagnostic tools? If so, leave a comment below.